 Alliance Equity Research
Bel Fuse’s Data Business Drives Sales Growth and Higher Manufacturing Margins
Bel Fuse’s data-related products are lifting sales and factory margins, with growth extending beyond its identifiable AI customers. Fourth-quarter guidance supports continued demand, while a larger share count, Enercon’s minority-interest valuation and inventory investment shape how operating gains translate into shareholder earnings and cash.

Bel Fuse’s third-quarter results show data-related demand producing a measurable improvement in manufacturing profitability. Sales increased 23.2% to $220.5 million, while operating profit rose 30.4% to $39.6 million. The industrial and data segment generated most of the additional revenue and expanded its gross margin, making it the principal source of the quarter’s operating improvement.
For investors, the opportunity extends beyond the revenue Bel can identify directly with AI customers. The more immediate evidence is stronger demand across its data products and better absorption of manufacturing costs. Assessing the benefit to shareholders also requires separating that operating progress from a larger share count and the accounting for Bel’s unfinished Enercon acquisition. The 28 October results are preliminary and unaudited; all financial figures below are in US dollars.
Components that make larger systems work
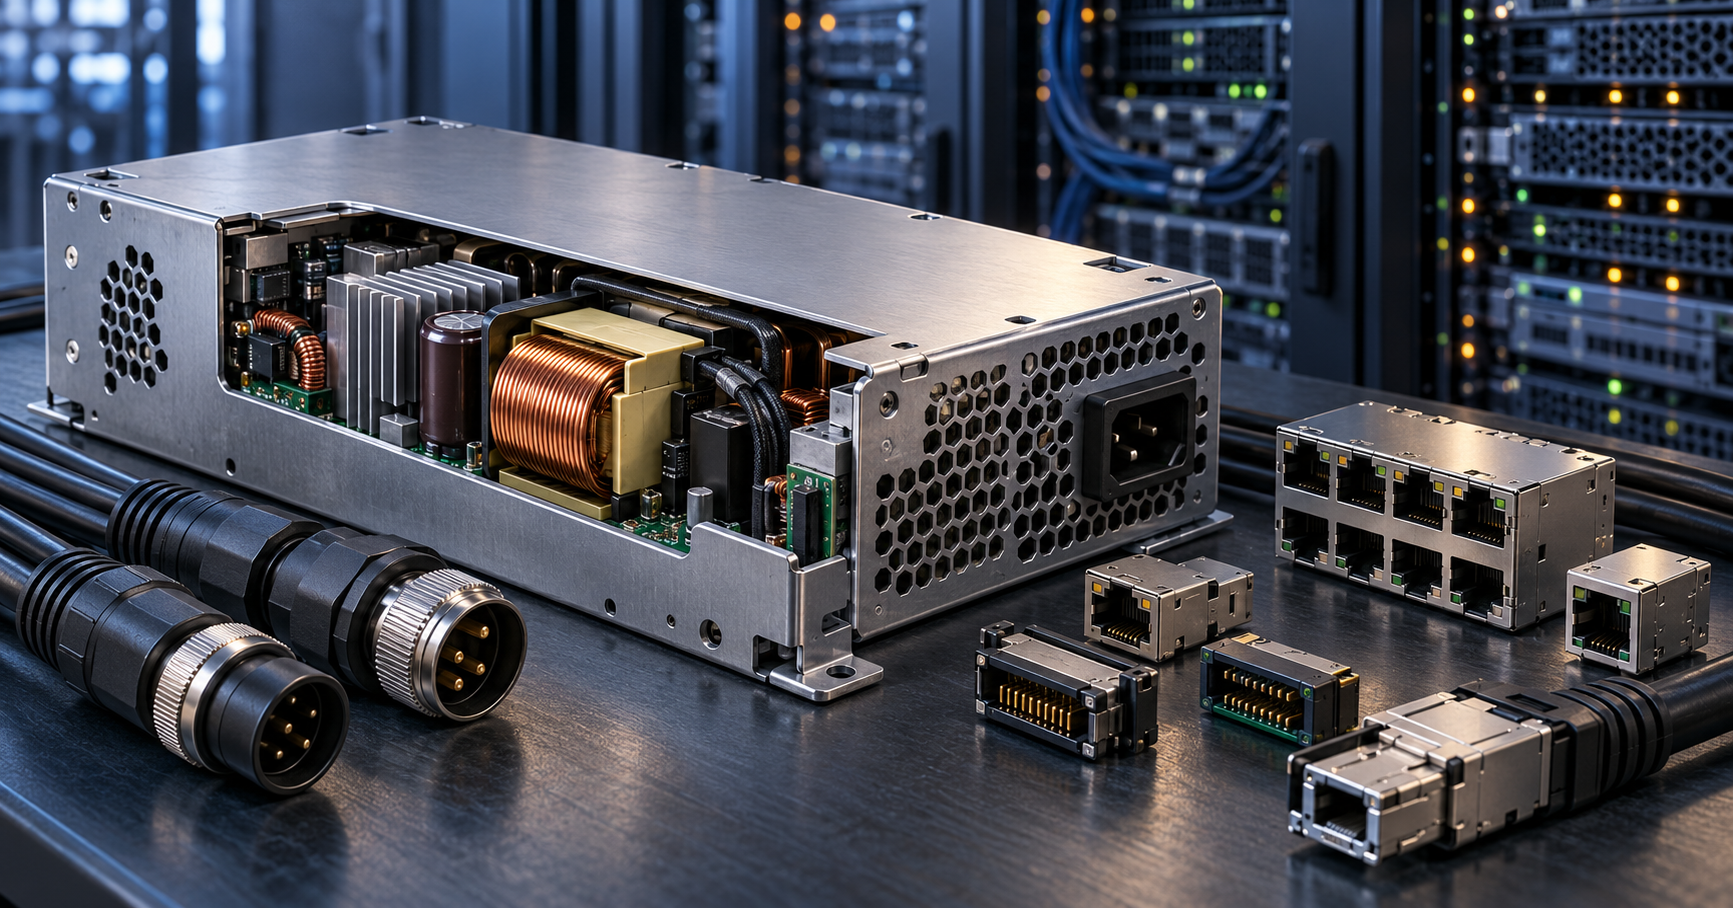
Bel Fuse, listed on Nasdaq through its BELFA and BELFB share classes, supplies power conversion, connectivity and circuit-protection products to equipment manufacturers. Power supplies convert electricity into the voltages electronic systems require; connectors, cable assemblies and networking components carry power and signals between parts of those systems.
Its customers incorporate these products into servers, storage equipment, industrial machinery, aircraft and defense systems. Bel therefore earns revenue from the hardware needed to operate larger systems, with a portfolio spanning standard products and customized components. Its annual report describes this combination of power, connectivity and magnetic products across multiple end markets.
The current reporting structure groups that portfolio into two segments. Aerospace, Defense & Rugged Solutions serves demanding applications where reliability and environmental resistance matter. Industrial Technology & Data Solutions includes the data-equipment and industrial markets now driving the faster growth.
| Business | Q3 2025 sales | Q3 2026 sales | Growth | Gross margin, 2025 → 2026 |
|---|---|---|---|---|
| Aerospace, Defense & Rugged Solutions | $96.3m | $106.6m | 10.7% | 41.1% → 39.6% |
| Industrial Technology & Data Solutions | $82.7m | $113.9m | 37.8% | 38.0% → 42.7% |
| Consolidated | $179.0m | $220.5m | 23.2% | 39.7% → 40.9% |
Industrial Technology & Data Solutions represented approximately 52% of quarterly sales and contributed 75% of the consolidated revenue increase, calculated from the disclosed segment figures. That changes the earnings mix: a business growing considerably faster than the group is also earning a higher gross margin than the other segment.
Data growth is broader than the identifiable AI contribution
On the 29 October earnings call, management said Data Solutions revenue increased by about $27 million, or 61%, from a year earlier. That accounts for roughly 65% of Bel’s $41.5 million consolidated sales increase.
Revenue from identifiable AI-focused customers was $12.4 million, up $9.2 million, and equivalent to 5.6% of total quarterly sales. Management describes this as a minimum identifiable exposure because it cannot trace every application through its broader customer base. The AI figure sits within the data business and should not be added to Data Solutions revenue as a separate category.
Acquisitions explain part of the expansion. The dataMate business purchased in March contributed $4.9 million of quarterly data revenue. It added Ethernet and broadband products that complement Bel’s existing networking components. That contribution accounts for about 18% of the disclosed $27 million data-sales increase, leaving substantial growth elsewhere in the business.
The economic benefit comes from selling more components through the manufacturing base while improving pricing and utilization. Additional production can spread factory overhead across more output, raising gross profit faster than revenue. The 4.7-percentage-point margin improvement in Industrial Technology & Data Solutions provides evidence of that effect, although purchasing costs, currency movements and product mix can change the outcome in subsequent quarters.
Operating improvement is stronger than headline EPS growth
The group retained part of its gross-profit improvement after supporting a larger business. Selling, general and administrative expenses increased in dollars but declined to 17.9% of sales from 18.3%. Operating margin consequently improved to 17.9% from 16.9%.
| Earnings measure | Q3 2025 | Q3 2026 | Change |
|---|---|---|---|
| Operating profit | $30.3m | $39.6m | +30.4% |
| Adjusted EBITDA | $39.2m | $52.5m | +34.0% |
| Earnings attributable to Bel shareholders | $22.3m | $26.3m | +18.2% |
| Class B basic earnings per share | $1.77 | $1.84 | +4.0% |
| Non-GAAP Class B basic earnings per share | $2.09 | $3.07 | +46.9% |
Two items explain much of the gap between operating growth and reported EPS. First, combined basic weighted-average shares increased approximately 14% to 14.4 million following the equity offering. Second, an $11.8 million redemption-value adjustment reduced earnings attributable to Bel shareholders.
The accounting bridge starts with consolidated net earnings of $38.4 million. After approximately $0.3 million attributable to the minority owner and the $11.8 million redemption adjustment, $26.3 million remained attributable to Bel shareholders. The redemption adjustment changes the allocation to shareholders without reducing operating profit or representing a current-quarter operating cash payment.
Bel’s non-GAAP shareholder earnings of $44.0 million add back that adjustment and a net $5.9 million of other items, including stock compensation, acquired-intangible amortization and acquisition-related adjustments, partly offset by gains. These figures help explain operating performance, but some exclusions carry economic costs or relate to future purchase payments.
The improvement is also more pronounced in the latest quarter than across the year to date. Nine-month operating margin was 16.7%, compared with 17.1% a year earlier. Sustaining the recent margin gains would therefore extend an improvement that is still developing.
Enercon links the earnings adjustment to a future cash payment
Enercon supplies customized power-conversion and networking equipment for aerospace and defense applications. Bel acquired an initial 80% interest in November 2024 and intends to purchase the remaining 20% by early 2027 under the transaction’s contractual arrangements.
The minority interest is redeemable through put-and-call provisions. Its valuation depends on earnings, so improvements in Enercon’s business can increase the amount associated with acquiring the remaining stake. The June quarterly filing explains this accounting mechanism; the September preliminary balance sheet carries the redeemable minority interest at $114.0 million.
That carrying value should not be treated as a fixed, newly agreed purchase price. Nevertheless, the adjustment matters economically: stronger subsidiary performance can increase both the earnings Bel hopes to retain and the price of completing ownership.
Enercon is already consolidated in Bel’s financial statements. Buying the remaining interest would increase the earnings retained by Bel’s shareholders, while removing the minority claim. It would not add another 20% of Enercon’s revenue to consolidated sales.
The equity raise supports growth, while inventory uses cash
Bel raised $441.6 million net from its May offering and used $197.5 million to repay outstanding borrowings. September cash was $333.1 million, with no long-term debt reported, although leases and acquisition-related obligations remained. The stronger balance sheet gives Bel capacity to fund the remaining Enercon interest and pursue other investments.
Operating cash generation has also improved. For the first nine months, operating cash flow was $66.0 million versus $51.0 million a year earlier. Deducting capital expenditure produces $54.9 million versus $42.5 million, a 29% increase by AER’s calculation, before acquisition payments and shareholder distributions.
Growth absorbed cash through inventories and receivables. Inventory investment used $56.5 million, while receivables used $32.6 million; increased supplier payables provided a partial offset. Management attributes much of the inventory build to securing materials for expected customer requirements.
Despite that investment, operating cash flow represented approximately 76% of consolidated net income in both nine-month periods. Cash conversion has therefore remained broadly stable. The relevant issue is whether inventory moves into shipments and collections as demand develops, allowing the improved manufacturing profits to support further growth without a disproportionate increase in working capital.
Fourth-quarter guidance supports continued demand
Third-quarter sales of $220.5 million and gross margin of 40.9% finished toward the upper end of the previous guidance: $205 million–$225 million and 39%–41%, respectively. The results delivered within those ranges, providing a useful baseline for interpreting the next outlook.
Fourth-quarter sales guidance of $220 million–$240 million implies approximately flat to 9% sequential growth, with a midpoint about 4% above the third quarter. Against fourth-quarter 2025 sales of $175.9 million, the range implies roughly 25%–36% growth. Guided gross margin of 40%–42% would keep profitability around the recently improved level.
AER’s assessment is that Bel has a broader data-driven earnings opportunity than the identifiable AI figure alone captures. The latest quarter demonstrates improved manufacturing economics, while the equity raise reduces financing pressure and spreads future earnings across more shares.
The next consequential evidence is whether gross margin holds within the guided 40%–42% range as sales remain elevated, accompanied by inventory converting into cash. Sustained margins and stable cash conversion would strengthen the case that current demand is producing durable shareholder earnings. Falling below that margin range while inventories continue rising would weaken the assessment.
This material is provided for informational and educational purposes only and does not constitute investment advice or a recommendation to buy or sell any security.
Companies Discussed
About AER Insights
Alliance Equity Research publishes timely insights on company-specific developments, industry trends, capital markets activity, and emerging investment themes across global public markets, with a particular focus on undercovered companies, sectors, and developments that often receive limited attention from mainstream financial research. Our analysis focuses on the financial, strategic, and valuation implications behind the headlines, using company disclosures, filings, market data, and sector context to help investors understand what matters, why it matters, and what to watch next.
Get AER Insights by Email
Receive new AER Insights and research updates in your inbox.
Related Insights
 Mining & Critical Minerals
US Lime’s Texas Kiln Nears Commissioning as Higher Costs Offset Revenue Growth
United States Lime & Minerals increased third-quarter revenue through higher prices and shipment volumes, while diesel costs and startup inefficiencies at its new Texas kiln reduced profit. Management expects final commissioning in the fourth quarter, when depreciation on the new equipment will begin. The company has ample cash to complete the project, but construction delays and early signs of slower Texas housing could limit demand for its output. Earnings improvement will require reliable production, lower unit costs and sufficient sales to earn a return on the investment.
 Biotechnology & Healthcare
INOVIO’s Voceryq Approval Shifts Attention to Patient Uptake, Competition and Launch Funding
INOVIO’s first approved DNA medicine offers a new approach to reducing airway surgery. Commercial adoption will depend on its treatment profile, reimbursement and competition, while management’s disclosed cash runway overlaps the planned launch quarter and continuing clinical obligations extend beyond it.
 Technology & Semiconductors
Corning’s Optical Growth Lifts Earnings as Customer Agreements Support Its Manufacturing Expansion
Corning’s optical-connectivity business is generating faster sales growth and higher profits as AI networks expand. Long-term customer agreements support additional manufacturing capacity, but the cash benefit includes advance payments. A slower solar ramp leaves optical profitability central to funding growth and improving shareholder returns.
 Technology & Semiconductors
Data I/O’s V-TEK Acquisition Broadens Its Offering but Adds Cash and Dilution Costs
Data I/O’s $23 million acquisition combines chip programming, handling equipment and outsourced services. The commercial fit is credible, but the cash commitment and convertible financing increase the earnings and cash contribution needed to reward shareholders. Disclosed acquired financial information remains insufficient to assess the purchase return.
About Alliance Equity Research
Alliance Equity Research publishes independent and company-sponsored equity research on undercovered, emerging, and high-potential public companies globally. Our analyst-built, model-backed research combines fundamental business analysis, financial forecasting, and valuation.
Email: info@alliancekp.com · Website: https://allianceequityresearch.com
For detailed company research, financial models, or coverage inquiries, contact our research team.
Research commentary for informational purposes. This document does not constitute personalized investment advice or a Buy, Hold, or Sell recommendation. For important disclosures, including information about research sponsorship and potential conflicts of interest, visit allianceequityresearch.com/disclosures.