
Charles H. Dow was the founder of the Dow-Jones Financial News Service in New York.
He is known as the father of modern technical analysis and was the first person to create an index that measures the overall price movement of U.S. stocks.
We’ll go through few Dow Theory Theorems:
- The First theorem of Dow Theory is that the ideal market consists of an uptrend, top, downtrend and bottom.
Below figure shows what an ideal market looks like.
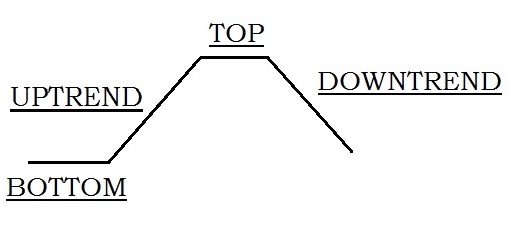
Markets are not that as easy as the above picture shows as Hamilton said “Normal market is the kind of market that never really happens”
Having said that doesn’t mean the above-said thing is not of use, it is to provide a generalized model of the stock market’s price behaviour over a period of time.
- The Second Theorem of Dow Theory is that economic rationale should be used to explain the stock market reaction.
Dow believed that industrial stocks represented the trend of industry profits and railroad stocks represented railroads profits and prospects, hence they had to go hand in hand. For eg: Industry may be producing goods, but if railroads are not shipping these goods, the industry will slow down.
- The Third theorem of Dow Theory is that prices trend. A trend is defined as the general direction in which the price tends to move.
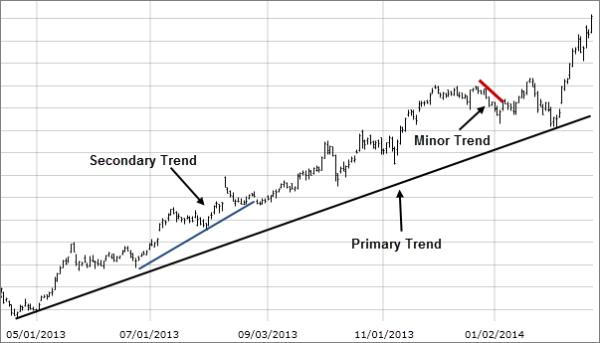
There are three types of trend: The first and most important is the primary trend, then comes the secondary trend and then minor.
Let’s dig deep into these individually as “Trend is your Friend”
Primary Trend:
For a technical analyst, the most important thing is to catch and identify the trend and there is no known method of forecasting the extent or duration of a primary movement.
Primary movement is the longest of all as it represents the overall movement of the price of the security.
A Bull market in case of Primary trend consists of three phases. First is represented when the bear market ends and confidence starts building up about correction.
Second, increased corporate earnings can help stock gain the momentum (Upside); and Third when prices rise on “hopes and expectations”.
A bear market in case of Primary trend also consists of three phases. First, when you anticipated a stock to do well earlier but your view has changed and the hope of getting returns from that stock is abandoned.
Second, when selling is due to decreased earnings of the company; and Third is panic selling, where even if the value is good people believe the worst is yet to come.
Secondary Trend
Secondary Trend is considered to be an important decline in a bull market or advance in a bear market, which lasts for about 3 weeks to maybe months.
It runs counter to the Primary Trend and being able to anticipate or recognize the secondary trend increases chances of profit by either booking profits early on or by going against the company (Short).
However, it’s dangerous because they both have similar characteristics and we tend to assume it will last longer but that might not be the situation, markets don’t behave as per we want (The earlier we understand this the better it is, nobody is bigger than markets).
Minor Trend
Minor Trend can be understood as the day to day movement for a reasonably less period as compared to the primary and secondary trend.
In other words we can call it a trap, it is believed that shorter the time frame more are the chances of prices to react abnormally.
Hence, it is advised to investors and traders to concentrate on a longer time frame as compared to a shorter one.
Confirmation
Dow Theory even introduced a concept which is highly important today which is “Confirmation”.
Confirmation means that both the industrial and railroad averages reach a new high or new low together on a daily basis (Closing Price).
Below is the example for the same, where both Industrial average and Railroad average made a new high, this means confirmation.
Hence, confirmation is the necessary means for recognizing in which direction the primary trend is headed.
Failure to reach new highs might be a signal of reversal and that primary trend may be reversing.
This alerts the analyst that there might be chances of a bear market.
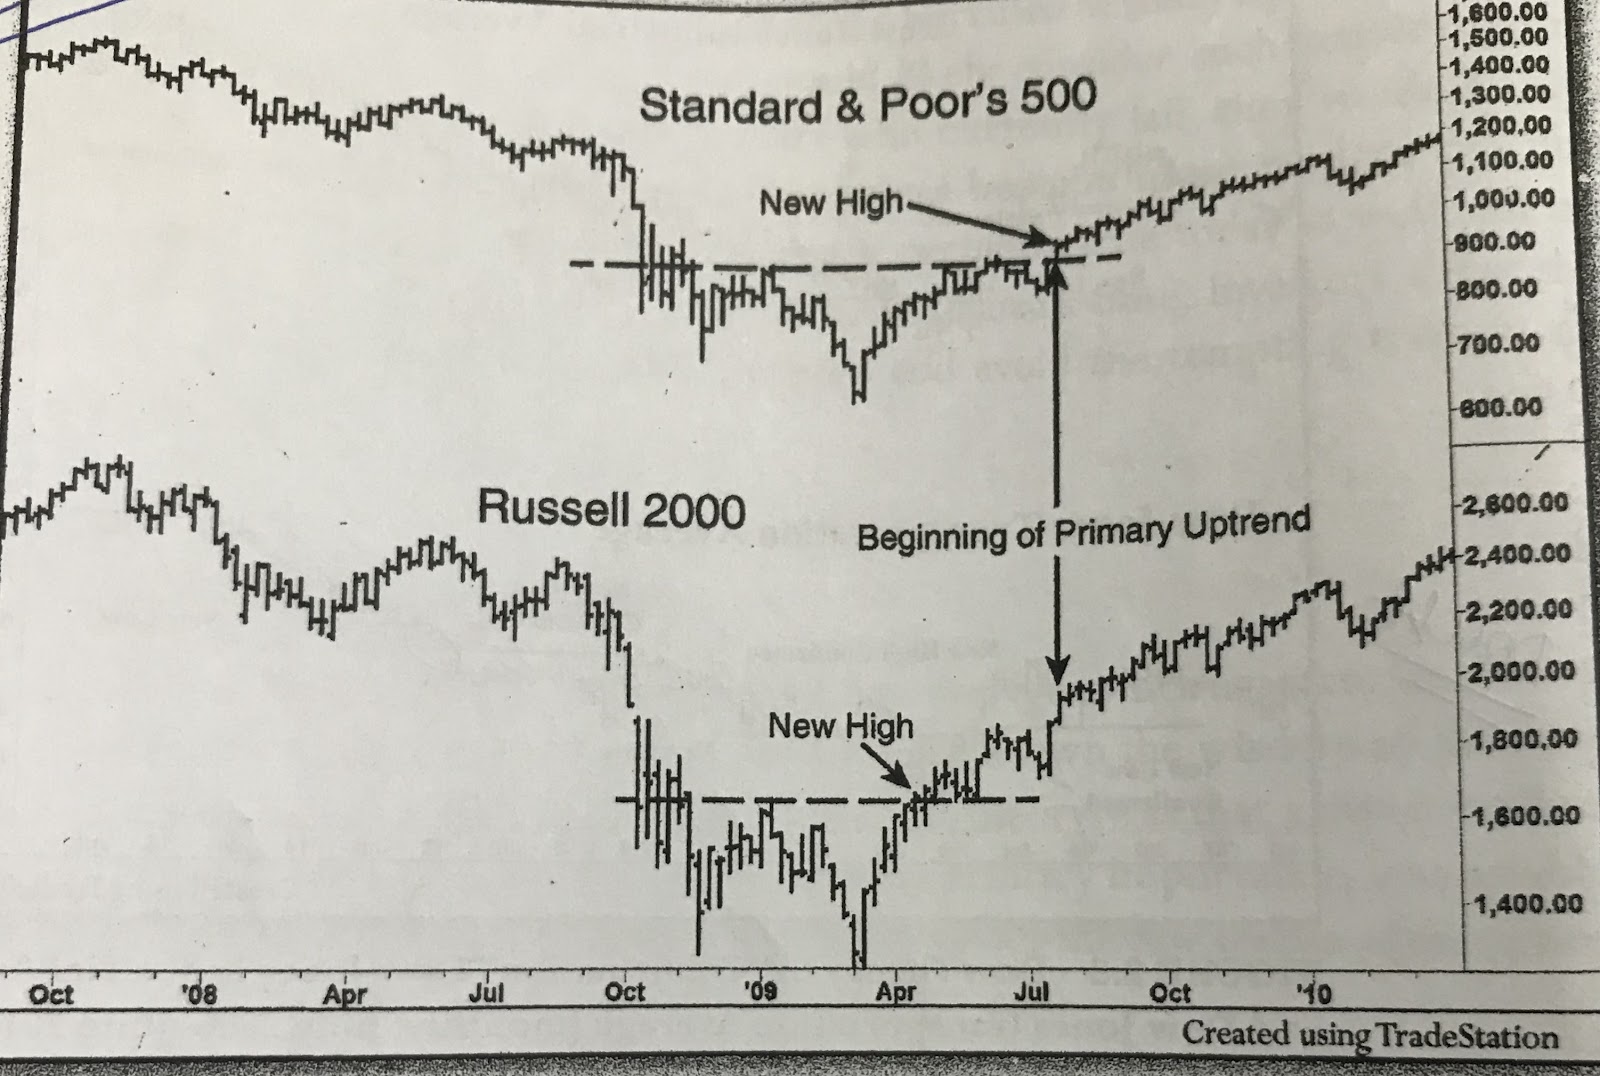
However, today with the advent of a wider base of industrial stocks and technology stocks, the usual method of confirmation of a primary trend is between Standard and Poor’s 500 and Russell 2000.
S&P 500 represents the largest, most highly capitalized companies in the United States and Russell 2000 represents smaller companies with higher growth.
Below the image will help you understand the concept better, this is a weekly chart from August 2007- March 2010.
When both reached a new high, there was Confirmation of the beginning of a primary trend.
When we talk about trends we can’t ignore the importance of volumes, as they play a huge role and act as a secondary confirmation.
So, let’s talk a bit about volumes.
Volumes:
There’s a saying “One should never sell a dull market short” this statement indirectly speaks about volumes, it cannot signal a trend reversal but it’s an important indication and acts as a secondary confirmation of a trend.
Whether it’s a rising market or a falling market, volumes will help you decide that you would like to ride the trend or not.
Conclusion:
Dow theory has never been formalised but his work has formed the basis for modern-day technical analysis. Despite the changes that have taken place in the market over the past many years, much of his basic work and ideas remain important even today. The classic theory of his still remains the best in the field of Technical and many complicated and complex structures are built taking his theory as a base.