
Centuries of work has passed by interpreting and understanding the movement of prices in financial markets and the product of it is “Technical Analysis”
“The art of technical analysis – for it is an art – is to identify trend changes at an early stage and to maintain an investment position until the weight of the evidence indicates that the trend has reversed.”
Martin J Pring
Many traders and investors hope to buy a stock at the beginning of an uptrend and then ride that trend and sell at a great price. Sounds simple, implementation is extremely tough.
It is traditional to examine the price, volume, and indicator information in charts. This not only is a prerequisite to the classic technical analysts but also for modern technical analysts.
How does a technical analyst make money exactly?
The money is made by “jumping” on the trend as early as possible, and a technical analyst always runs the risk of spotting the beginning of a trend too late and missing potential profit.
A trader must choose when to enter a position, and second, he must choose when to exit a position. Choosing when to exit a position consists of two decisions: the trader must choose when to exit to capture a profit when prices move in the expected direction and when to book loss when they move in the opposite direction ( Stop-Loss).
One of the many advantages of being a Technical Analyst is because it studies prices, risk of loss can, therefore, be determined and quantified right at the beginning of the investment.
“The trend is your friend” – Play the Trend
An upward trend occurs when prices reach higher peaks and higher troughs. A downtrend is opposite when prices reach lower troughs and lower peaks. A sideways trend or consolidation occurs when prices trade in a range.
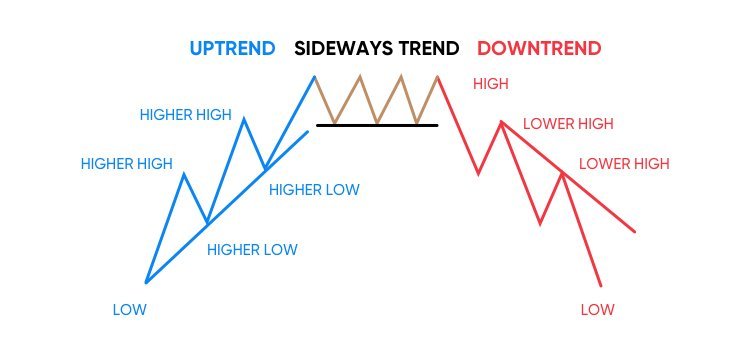
A trend is a directional movement of prices that remains in effect long enough to be identified and be profitable. Determining a trend is difficult, and hence various traders use different methodologies like Moving Averages, Trendlines, etc.
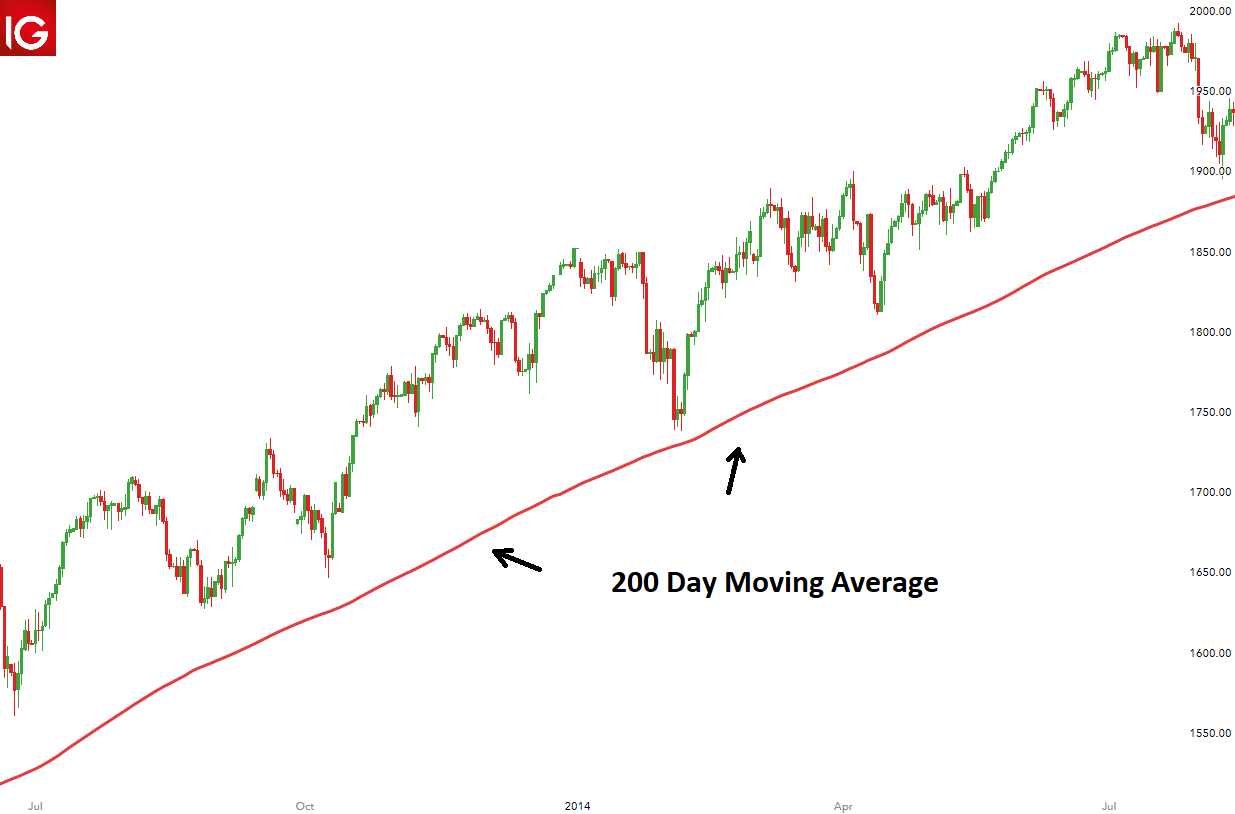
Moving Averages and Trend
Moving Average is one of the oldest tools used by Technical Analysts, they use them to smooth the data, making it easier to view the underlying trend of the stock.
For example, a 50-day moving average is used to determine for the past 50 days. It filters out the prices for the past 50 days and tells us as a whole where the trend is headed.
How does a trend occur? It occurs due to Supply and Demand. Each buyer ( demand ) bids for a certain quantity at a certain price and each seller ( supply ) asks for a certain quantity at a certain price.
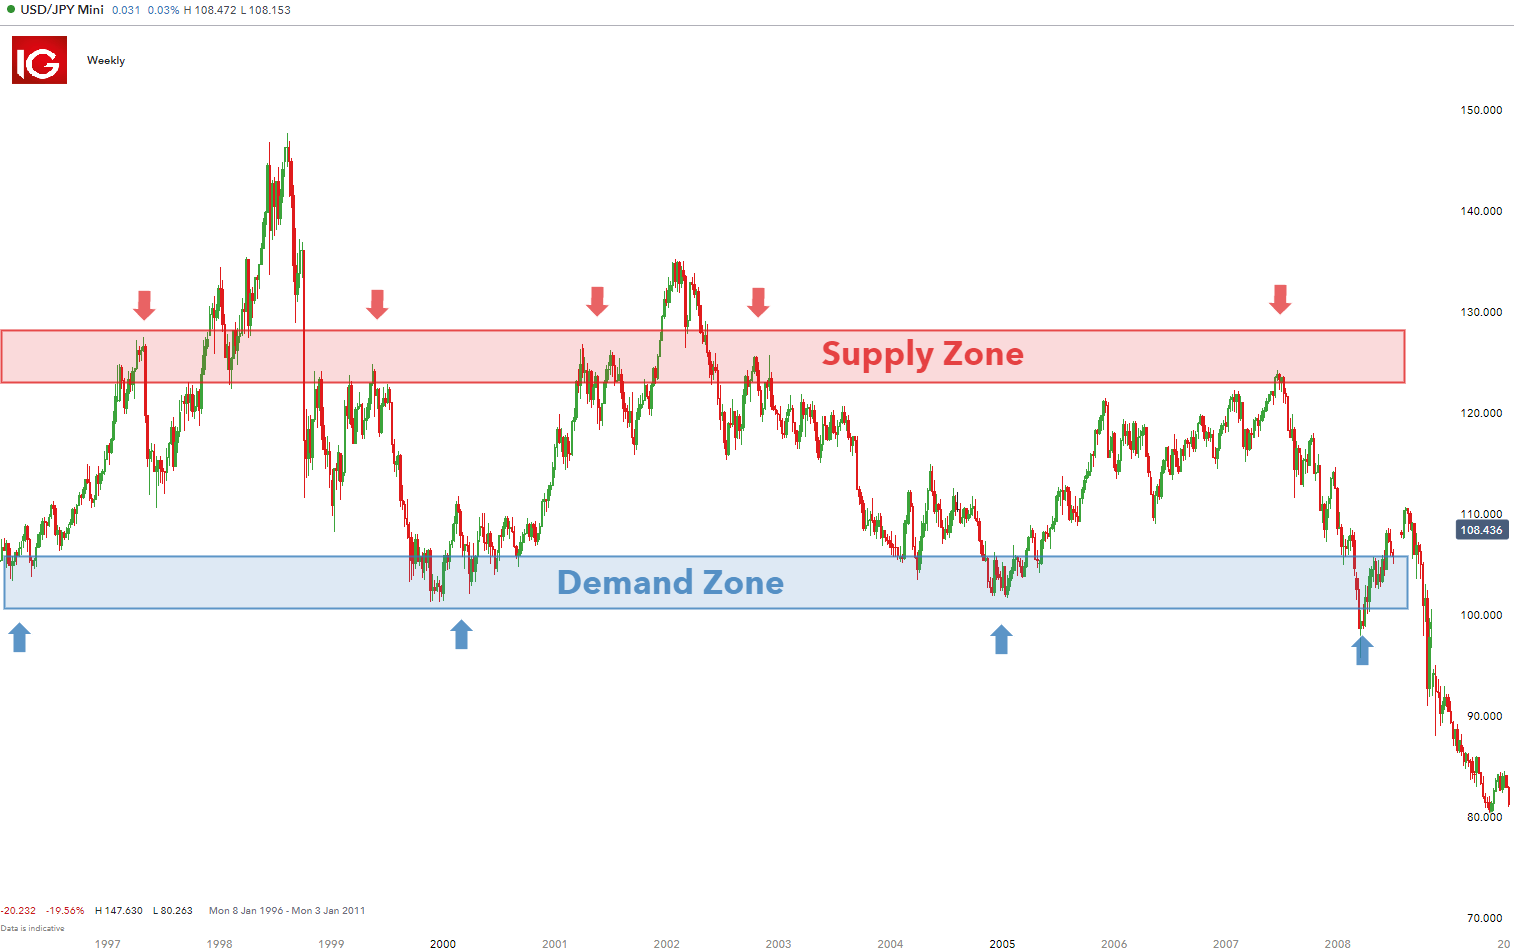
Price, therefore, is the end result of all those factors, and it is the result of the supply and demand at that instant in time. Thus, a technical analyst believes it is futile to analyze the components of supply and demand, and prices play an important role.
” Bhaav Bhagwaan Che”
Rohan Mehta